Day 16 - Minimalist Map - The East Coast

This seemed like such a simple challenge going into it, but it possessed some unique challenges I wasn’t expecting. When I decided on the map, I wanted to create I followed my typical process of defining what data I was going to need and started to collect it. The map below shows everything I collected for this map. The first was a GIS Shape layer that contained all the state outlines. A second layer identified all the urban areas within the United States.

The first challenged I faced was isolating the coastline from all the state data.

I was able to achieve this by writing some custom filters in QGIS. I was also happy to find out the bays and covers were part of the shape layer even though they were not visible at first glance. Once the filters were applied, I styled the layer to remove all buffers and show the exact coastline. This was the result.
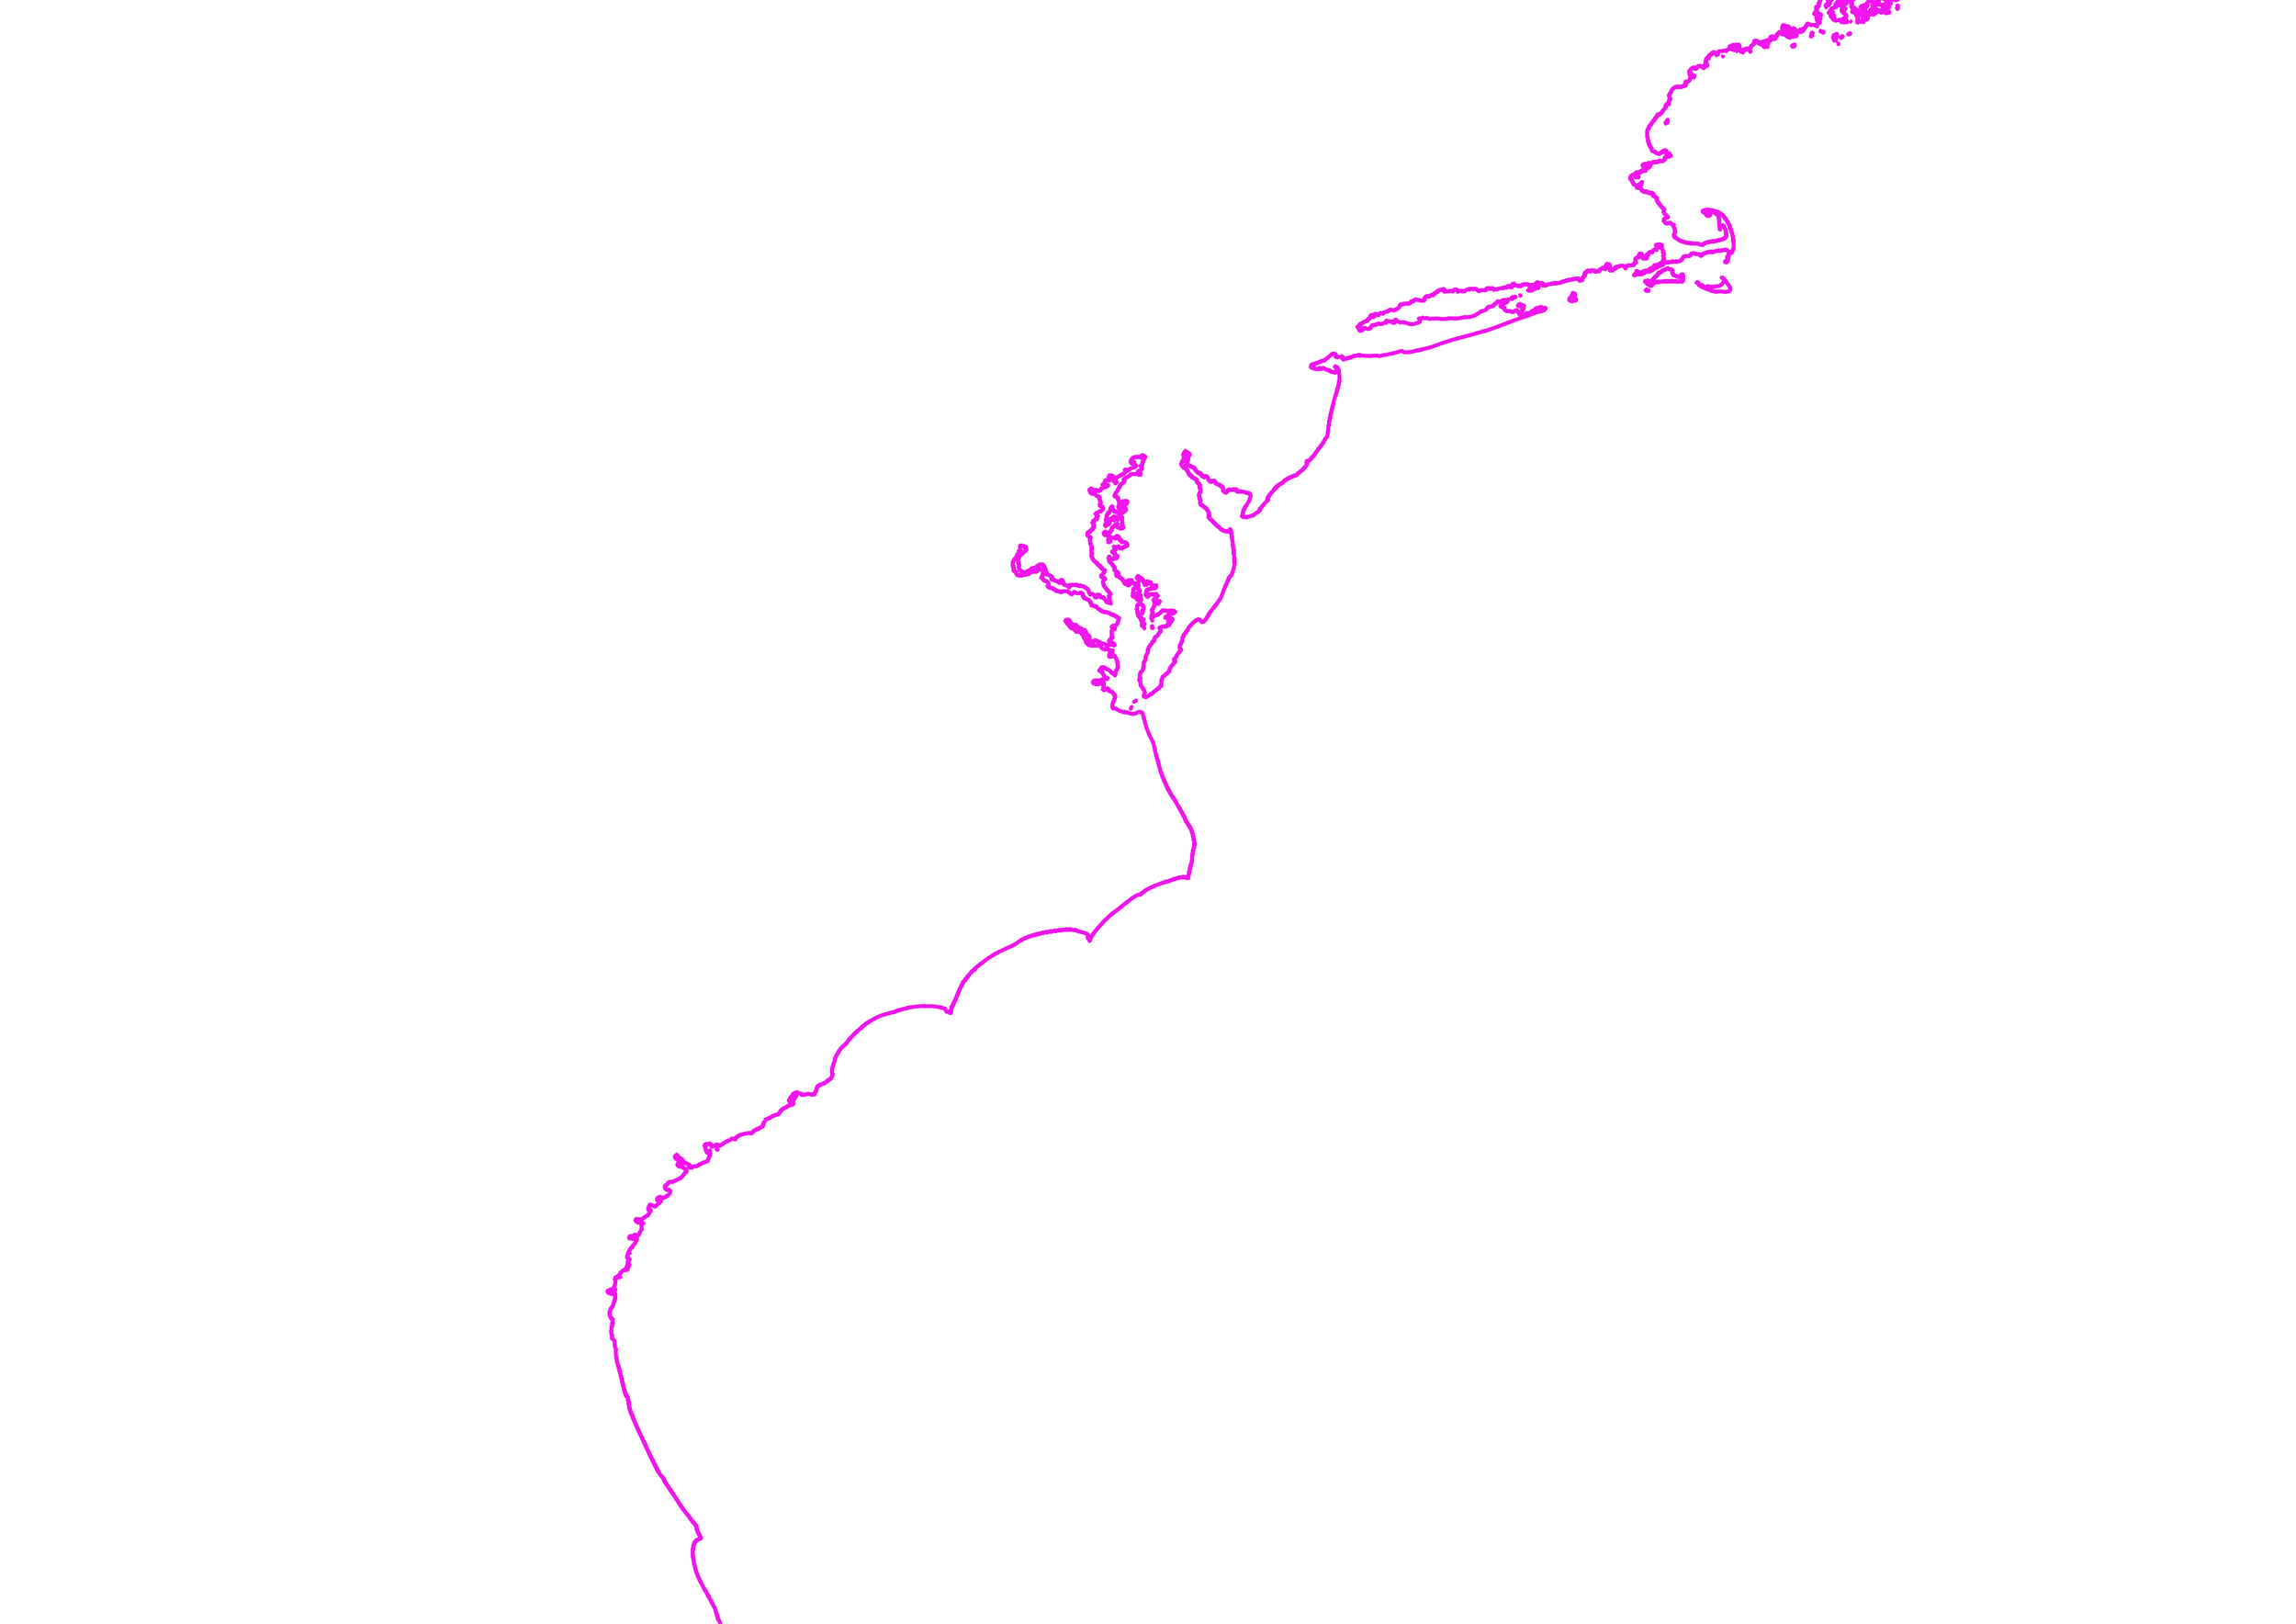
I applied some simple styles to end up with this coastline for the final map.

Next I overlayed the urban information I was able to collect over the coastline data. I was able to remove the spatial information (green areas) and leave only labels.


Now that I had the city labels, I realized I had to take one step back to isolated cities that were along the coastline. To do this I created a 20-mile buffer around the coast and used that buffer to select urban areas that fell within that buffer.

Another challenge I had to face was the way urban areas were being displayed over the bays and coves along the coast. This was not leaving a clean look. To address this I had to break the labels up into 5 distinct layers. These layers were broken down into labels that were shown on the left and right of the coastline and three other layers were added to format the spacing from the coastline. These layers minimized the amount of overlap the labels had with the coastline and with themselves.
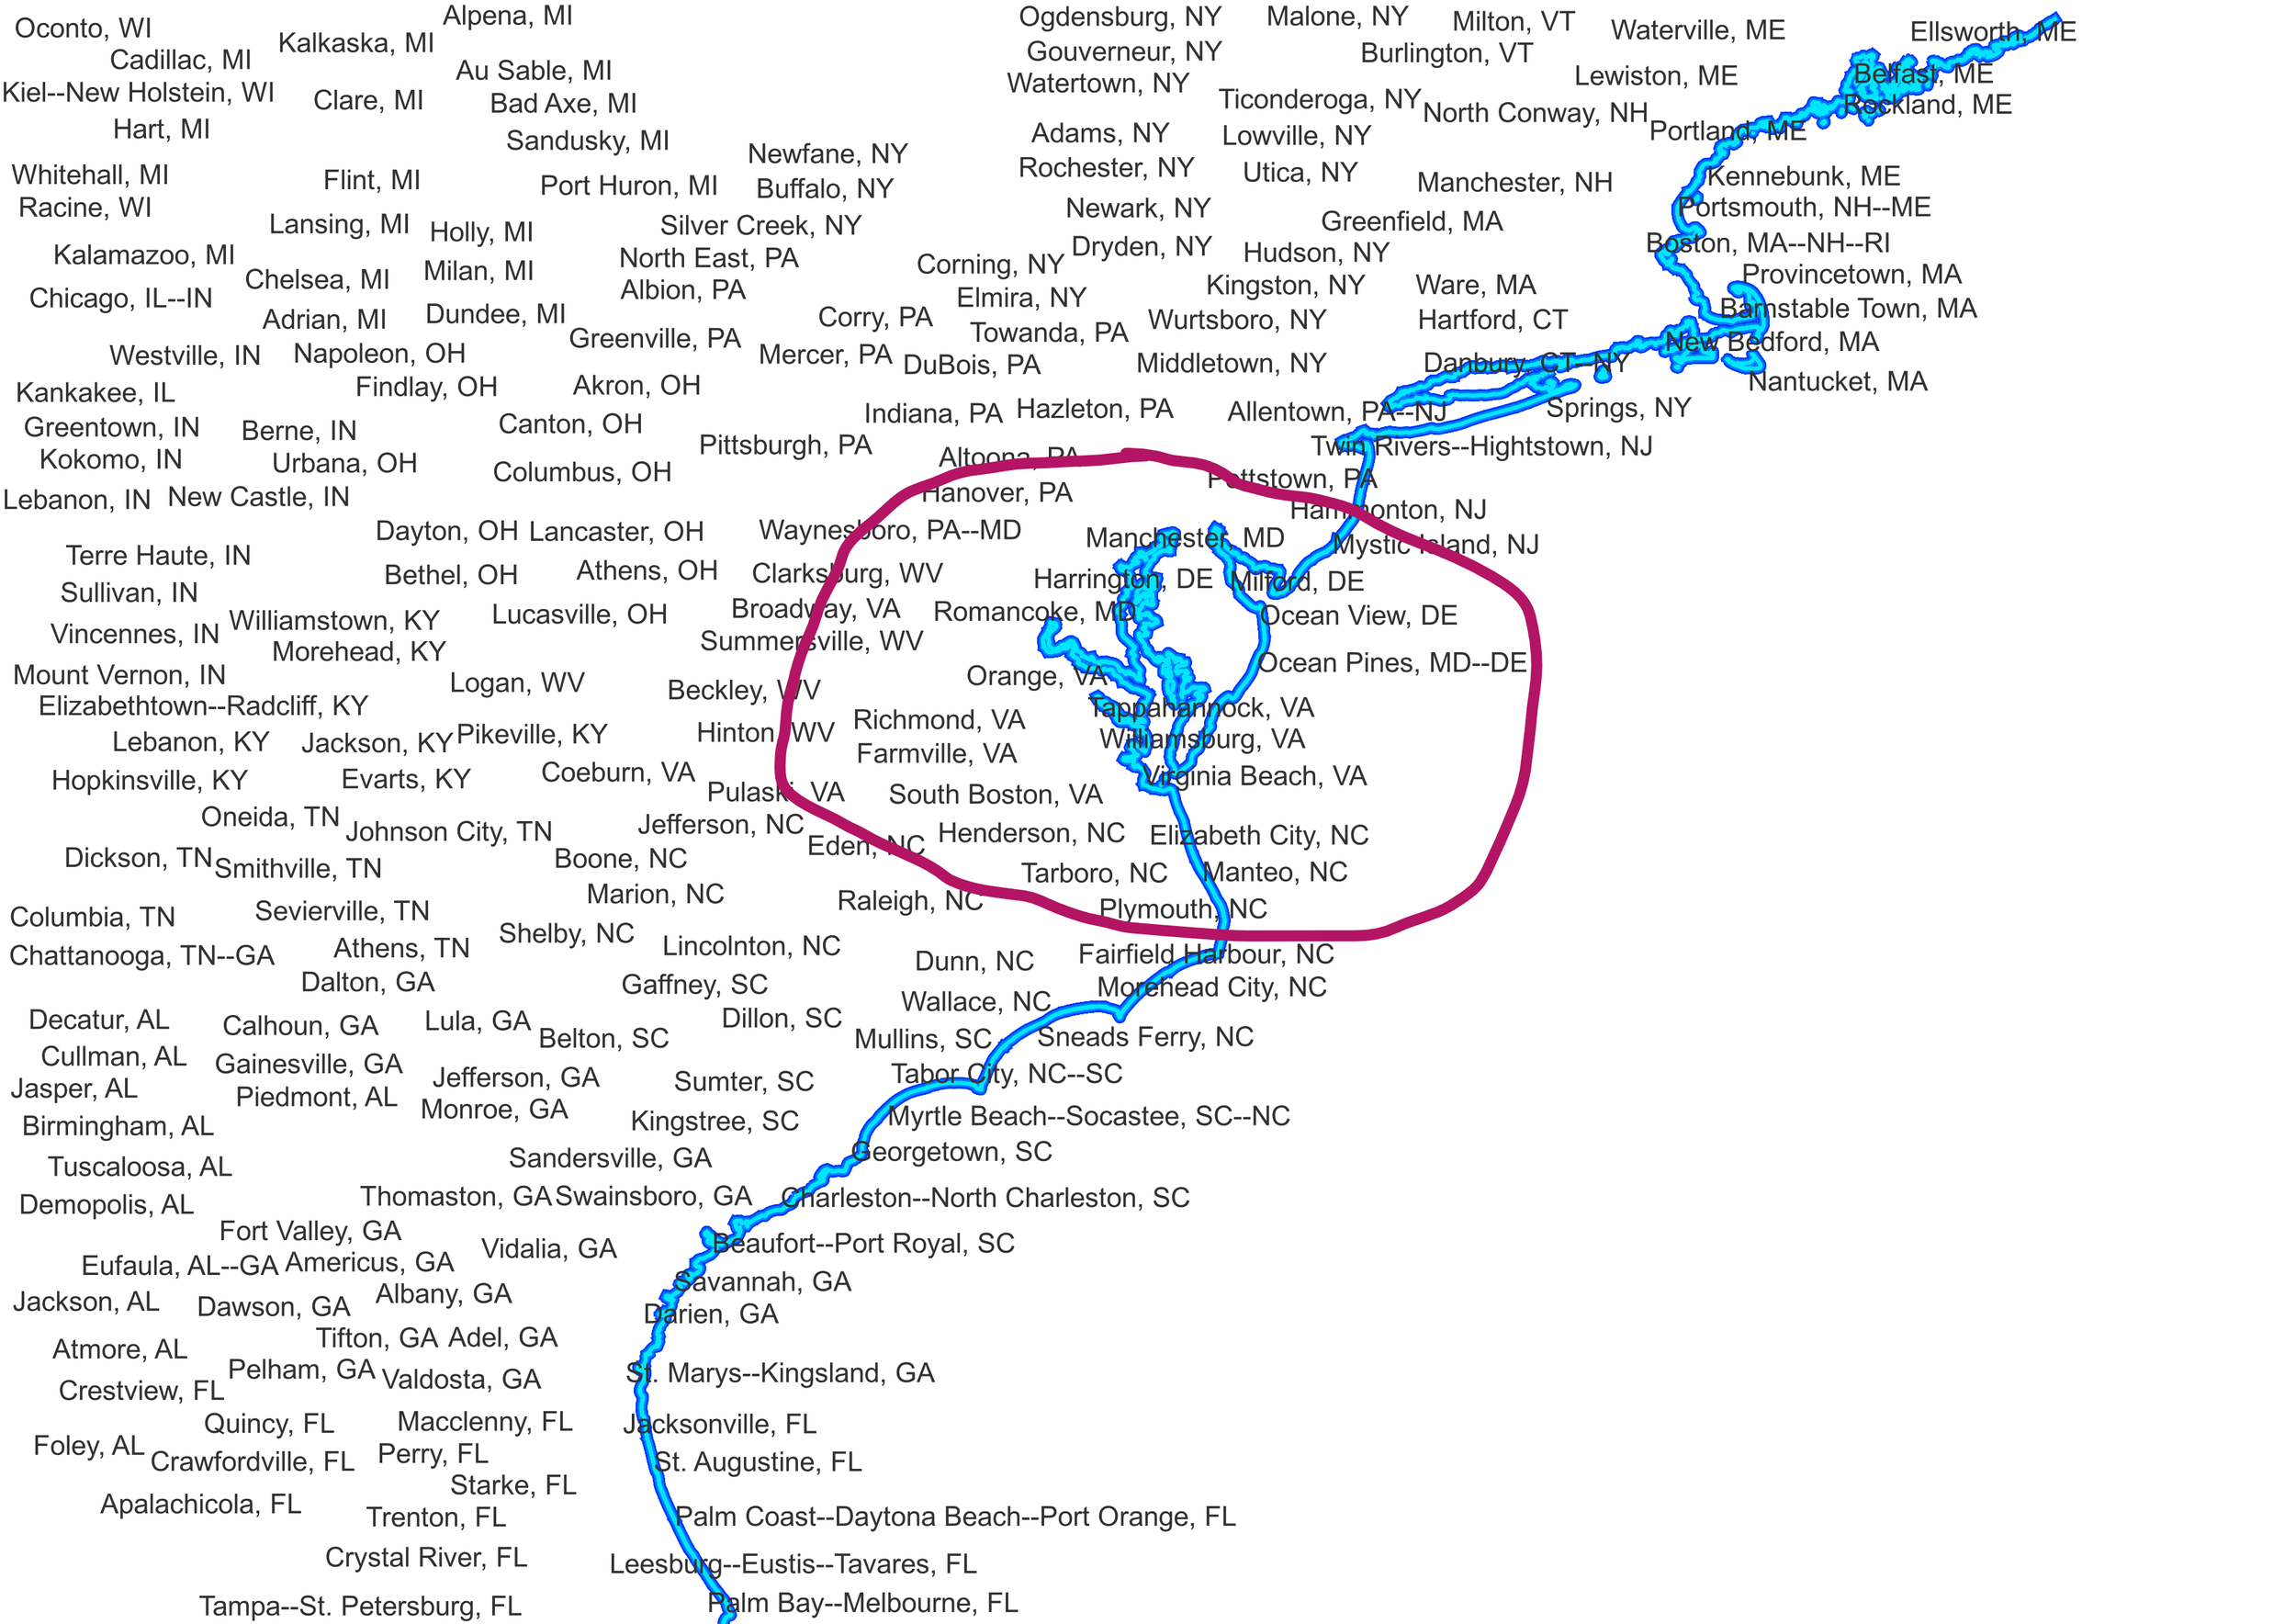

This is the result.
