Investigating the accuracy of weather models for Doylestown, Pennsylvania
As an avid outdoors enthusiast, my love for activities such as hiking, cycling, golfing, skiing, camping, photography, and flying drones has driven me to call Doylestown, Pennsylvania my home. Located in the heart of the East Coast, Doylestown offers easy access to the mountains, beaches, and major metropolitan areas such as Philadelphia, New York City, Baltimore, Washington D.C., Pittsburgh, and Boston. With such a diverse range of outdoor hobbies, it is essential for me to have a reliable understanding of the upcoming weather conditions. This is what sparked my investigation into the accuracy of weather models for the Doylestown area. My goal for this paper is to examine the reliability and accuracy of these models, and to identify any potential improvements that could be made to better serve the needs of outdoor enthusiasts like myself.
For my investigation into the accuracy of weather models in Doylestown, Pennsylvania, I collected data from the Weather Channel on a daily basis. Specifically, I collected data on the predictions for the following day, including the date, predicted high temperature, predicted low temperature, and predicted weather condition. The following day, I then collected actual weather data every hour of the day, including the time and date of the sample, the current temperature, current weather conditions, UV index, humidity, wind speed, wind direction, pollen count, and the times of sunrise and sunset.
One of the main areas of focus for my analysis was the accuracy of temperature predictions. However, in the future I also plan to examine the accuracy of weather condition predictions and potentially multi-day forecasts as well. With this data, there are many potential avenues for exploration and analysis, such as examining the overall accuracy of the weather model, identifying any potential biases or patterns in the data across seasons or geographical areas, and examining the effect of different weather conditions on the accuracy of the model. Overall, this data provides a rich resource for understanding the accuracy and reliability of weather models in the Doylestown area.
Earlier I stated why I am interested in this type of research but there are several reasons why someone might be interested in testing a weather model for their specific area. Reasons include:
Planning: Accurate weather predictions can be useful for planning various activities, such as outdoor events, travel, or agriculture. Testing a weather model for a specific area can help to determine its accuracy and reliability, which can inform decision-making about these activities.
Safety: Weather can have significant impacts on safety, especially in areas prone to severe weather events such as hurricanes, tornadoes, or heavy snowfall. Testing a weather model for a specific area can help to identify any potential hazards and allow individuals and organizations to take appropriate precautions.
Business: Many businesses rely on accurate weather forecasts for their operations. For example, a retailer may need to know if there is a high probability of rain in order to decide whether to stock up on rain gear, while a farmer may need to know if there is a high probability of drought in order to decide whether to irrigate their crops. Testing a weather model for a specific area can help businesses to make informed decisions about their operations.
Research: Testing a weather model for a specific area can also be of interest to researchers who are studying the local weather patterns or the performance of the model itself. This can help to improve our understanding of the local weather and the factors that influence it, as well as the accuracy and reliability of the model.
Overall, testing a weather model for a specific area can be useful for a variety of purposes, including planning, safety, business, and research. By evaluating the model's accuracy and reliability, individuals and organizations can make more informed decisions and take appropriate actions based on the predicted weather conditions.
It is important to understand Weather models are complex tools that are used to predict and forecast the weather. These models take into account a wide range of variables in order to make their predictions, including:
Temperature: Temperature is a key variable that affects the weather, as it influences the movement of air and the formation of clouds and precipitation. Weather models take into account the temperature at various levels of the atmosphere, as well as the temperature of the land and water surfaces.
Humidity: Humidity refers to the amount of moisture in the air, and it can have a significant impact on the weather. Weather models take into account the humidity at various levels of the atmosphere, as well as the humidity of the land and water surfaces.
Wind: Wind is another important variable that affects the weather, as it can influence the movement of air masses, the formation of clouds and precipitation, and the transfer of heat and moisture. Weather models take into account the wind speed and direction at various levels of the atmosphere.
Pressure: Atmospheric pressure is the force exerted by the weight of the air, and it can have an impact on the weather. Weather models take into account the pressure at various levels of the atmosphere, as well as the pressure of the land and water surfaces.
Precipitation: Precipitation, such as rain or snow, is an important variable that affects the weather, as it can influence the temperature, humidity, and other factors. Weather models take into account the type, amount, and distribution of precipitation in an area.
Land and water surfaces: The characteristics of the land and water surfaces can also have an impact on the weather. For example, the temperature of the land and water surfaces can influence the temperature of the air, and the roughness of the land surface can affect the wind. Weather models take into account the characteristics of the land and water surfaces in an area.
There are many challenges that weather models need to overcome in order to make accurate predictions. One of the main challenges is the complexity of the atmosphere and the numerous variables that influence the weather. Another challenge is the limited availability of data, as there are many areas of the world where weather observations are scarce or nonexistent. Additionally, weather models need to account for the uncertainty inherent in weather forecasting, as it is not always possible to predict the exact path or intensity of a weather system. Finally, weather models need to be able to accurately represent the physical processes that occur in the atmosphere, such as the transfer of heat and moisture, the formation of clouds and precipitation, and the movement of air masses.
Overall, weather models are complex tools that take into account a wide range of variables in order to make their predictions. These models face numerous challenges, including the complexity of the atmosphere, the limited availability of data, the inherent uncertainty in weather forecasting, and the need to accurately represent physical processes. However, despite these challenges, weather models are an important tool for understanding and forecasting the weather, and they continue to improve as our understanding of the atmosphere and the capabilities of computer modeling advance.
Models, such as weather prediction models, are important tools that are used to understand and forecast complex systems. It is crucial to thoroughly test these models to ensure that they are accurate and reliable, and statistical analysis plays a crucial role in this process. There are several reasons why testing models is important:
Validity: Testing helps to ensure that a model is valid, which means that it accurately represents the real-world system it is intended to model. Without testing, there is a risk that a model may contain errors or oversights that could lead to inaccurate predictions or decisions.
Reliability: Testing also helps to ensure that a model is reliable, which means that it produces consistent results over time. If a model is not reliable, it may produce different predictions or results depending on when or how it is used, which could lead to confusion or inconsistency.
Efficiency: Testing can help to identify areas where a model can be improved or made more efficient. For example, if a model is taking a long time to run or using a lot of resources, testing can help to identify the specific components that are causing these issues and suggest ways to optimize them.
There are several techniques that can be used to test models, including:
Verification: Verification involves comparing a model's predictions or results to known, real-world data to see how well it matches up. This can help to identify any errors or biases in the model and suggest ways to improve it. Statistical analysis is often used to compare the model's predictions to the real-world data, using measures such as mean squared error or correlation coefficient.
Validation: Validation involves comparing a model's predictions or results to a different set of real-world data that was not used to build the model. This helps to ensure that the model is not overfitting (i.e., performing well only on the data it was trained on) and can generalize to new situations. Statistical analysis can be used to compare the model's predictions to the validation data, using measures such as mean absolute error or R-squared.
Sensitivity analysis: Sensitivity analysis involves testing how sensitive a model is to changes in its input parameters or assumptions. This can help to identify any areas where the model is particularly sensitive or uncertain, which can inform decisions about how to use it. Statistical techniques such as analysis of variance or partial least squares regression can be used to perform sensitivity analysis.
Overall, testing models is important because it helps to ensure that they are accurate, reliable, and efficient. By using techniques such as verification, validation, and sensitivity analysis, and applying statistical analysis to compare the model's predictions to real-world data, it is possible to identify and address any issues with a model, which can improve its performance and usefulness.
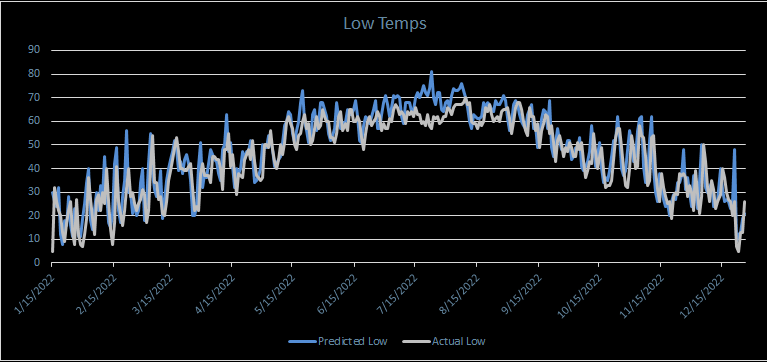
In my investigation into the accuracy of weather models in Doylestown, Pennsylvania, I collected 7665 data points across 365 days. From this data I was able to find that the model the Weather Channel uses was better at predicting low temperatures compared to high temperatures over the year of 2022. Specifically, the standard deviation for predicted high temperatures was ±9.1 degrees, while the standard deviation for predicted low temperatures was only ±4.8 degrees.


However, I also found that the standard deviation for predicting high temperatures varied depending on the season. During the winter, the standard deviation for predicting high temperatures was ±11.7, while in the summer it was only ±2.7. The standard deviation for predicting high temperatures in the spring was ±5.8, and in the fall it was ±5.9.


Overall, these findings suggest that the accuracy of the weather model is highly dependent on the season, with the model being more accurate at predicting high temperatures in the summer and less accurate in the winter. It means that there is a higher level of variability or uncertainty in the accuracy of the predicted high temperatures during the winter compared to the summer.
The standard deviation is a measure of how much the values in a dataset vary from the mean (average) value. A larger standard deviation indicates that the values in the dataset are spread out over a wider range, while a smaller standard deviation indicates that the values are concentrated closer to the mean.
In this case, the standard deviation of ±11.7 during the winter means that the predicted high temperatures are likely to be less accurate and more variable than the predicted high temperatures during the summer, which have a standard deviation of ±2.7. This could be due to a variety of factors, such as changes in weather patterns, the presence of more extreme temperatures, or the presence of more unpredictable weather events.
This information can be useful in a number of ways. For example, if you are trying to plan for the winter months and want to know how accurate the predicted high temperatures are likely to be, the standard deviation of ±11.7 can give you an idea of the level of uncertainty you should expect. Alternatively, if you are trying to compare the accuracy of weather forecasts between the winter and summer months, the difference in standard deviation between the two seasons can help you understand which season is more predictable.